
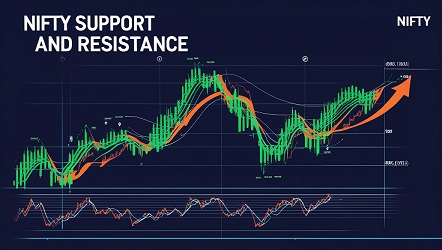
Support and resistance for nifty Pine Script Code (TradingView)
Have you ever felt lost in the sea of stock market fluctuations, desperately seeking a compass to guide your trading decisions? 🧭📊 Look no further than the powerful concepts of support and resistance in the Nifty index. These invisible yet influential lines can be the key to unlocking profitable trades and minimizing risks.
Support and resistance levels act as crucial waypoints in the Nifty's journey, often determining where prices might pause, reverse, or break through. But here's the catch: while many traders are aware of these concepts, few truly understand how to harness their potential. Are you ready to dive deep into the world of support and resistance and transform your Nifty trading strategy? 💡💼
In this comprehensive guide, we'll explore everything from the basics of understanding support and resistance to advanced techniques for analysis. We'll uncover the different types of support and resistance, reveal key levels for Nifty, and share practical trading strategies. Plus, we'll help you avoid common pitfalls that trap even experienced traders. So, buckle up as we embark on this journey to master the art of support and resistance in Nifty trading!
Understanding Support and Resistance in Nifty
A. Definition of support and resistance levels
Support and resistance levels are crucial concepts in technical analysis for the Nifty index. These levels represent price points where the index tends to experience a pause or reversal in its movement.
- Support: A price level where buying pressure is expected to overcome selling pressure, potentially halting a downward trend.
- Resistance: A price level where selling pressure is expected to overcome buying pressure, potentially halting an upward trend.
B. Importance in technical analysis
Support and resistance levels play a vital role in technical analysis for Nifty traders:
- Identifying potential entry and exit points
- Determining stop-loss levels
- Predicting trend reversals
- Gauging market sentiment
| Aspect | Support | Resistance |
|---|---|---|
| Direction | Upward | Downward |
| Trading action | Buy | Sell |
| Risk management | Place stop-loss below | Place stop-loss above |
C. How to identify these levels on Nifty charts
Identifying support and resistance levels on Nifty charts requires careful analysis:
- Historical price action: Look for areas where the index has repeatedly bounced or reversed.
- Round numbers: Pay attention to psychologically significant levels (e.g., 18,000, 18,500).
- Trendlines: Draw lines connecting higher lows (support) or lower highs (resistance).
- Moving averages: Popular indicators like the 50-day and 200-day moving averages often act as support or resistance.
- Fibonacci retracements: Use these levels to identify potential support and resistance areas.
By mastering these techniques, traders can effectively identify support and resistance levels for Nifty, enhancing their trading strategies and decision-making processes. Next, we'll explore the various types of support and resistance specific to the Nifty index.
Types of Support and Resistance for Nifty
Horizontal levels
Horizontal support and resistance levels are crucial in Nifty trading. These levels represent price points where the index has historically struggled to move beyond, either upward or downward. Traders often identify these levels by looking at:
- Previous highs and lows
- Round numbers (e.g., 18,000, 18,500)
- Psychologically significant levels
| Level Type | Description | Example |
|---|---|---|
| Support | Price floor | 17,800 |
| Resistance | Price ceiling | 18,200 |
Diagonal levels (trendlines)
Diagonal support and resistance levels, also known as trendlines, are drawn by connecting a series of highs or lows on a Nifty chart. These lines indicate:
- Uptrends (higher lows)
- Downtrends (lower highs)
- Potential breakout or breakdown points
Moving averages
Moving averages act as dynamic support and resistance levels for Nifty. Common moving averages used include:
- 50-day MA
- 100-day MA
- 200-day MA
These averages can:
- Provide support during uptrends
- Act as resistance during downtrends
- Signal potential trend reversals
Fibonacci retracements
Fibonacci retracements are powerful tools for identifying potential support and resistance levels in Nifty. Key Fibonacci levels include:
- 23.6%
- 38.2%
- 50%
- 61.8%
Traders use these levels to:
- Identify potential reversal points
- Set entry and exit targets
- Confirm other support and resistance levels
Understanding these types of support and resistance levels is essential for effective Nifty trading. Now that we've covered the various types, let's explore the key support and resistance levels specific to Nifty.
Key Support and Resistance Levels for Nifty
Major psychological levels
In Nifty trading, major psychological levels play a crucial role in support and resistance analysis. These levels often act as significant barriers or catalysts for price movements. Here are some key psychological levels to watch:
- 10,000
- 15,000
- 20,000
These round numbers tend to attract more attention from traders and investors, often resulting in increased trading activity and potential trend reversals.
Historical highs and lows
Historical highs and lows are essential reference points for identifying support and resistance levels in Nifty. These levels represent:
- Previous market peaks
- Market bottoms
- Significant turning points
| Time Frame | Historical High | Historical Low |
|---|---|---|
| All-time | 18,887.60 | 1,253.90 |
| 52-week | 18,887.60 | 15,183.40 |
Traders often use these levels to make informed decisions about entry and exit points.
Round numbers and their significance
Round numbers hold special significance in Nifty trading due to their psychological impact on market participants. Some key aspects include:
- Tendency for price to pause or reverse near round numbers
- Increased liquidity around these levels
- Self-fulfilling prophecy effect
Round numbers to watch in Nifty:
- Multiples of 100 (e.g., 17,300, 17,400)
- Multiples of 500 (e.g., 17,500, 18,000)
- Multiples of 1,000 (e.g., 17,000, 18,000)
These levels often serve as important support and resistance zones, influencing trading decisions and overall market sentiment. Traders should pay close attention to price action around these levels for potential trading opportunities.
Psychology Behind Support and Resistance
A. Buyer and seller behavior
The psychological dynamics between buyers and sellers play a crucial role in shaping support and resistance levels in the Nifty index. These levels often emerge as a result of collective market behavior, where participants' actions are driven by their perceptions of value and risk.
- Buyers tend to:
- Enter the market when prices reach perceived "bargain" levels
- Increase their positions as prices approach previous support levels
- Become hesitant as prices approach resistance levels
- Sellers typically:
- Look to exit positions when prices reach perceived "overvalued" levels
- Increase selling pressure as prices approach previous resistance levels
- Become cautious about selling as prices near support levels
This interplay creates a dynamic equilibrium that reinforces support and resistance zones.
B. Market sentiment and emotions
Market sentiment and emotions significantly influence the formation and strength of support and resistance levels. These psychological factors can be categorized into:
| Emotion | Effect on Support | Effect on Resistance |
|---|---|---|
| Fear | Strengthens | Weakens |
| Greed | Weakens | Strengthens |
| Hope | Reinforces | Challenges |
| Regret | Creates new levels | Intensifies existing |
Traders often make decisions based on these emotional responses, leading to the creation and reinforcement of key price levels.
C. Self-fulfilling prophecy effect
The self-fulfilling prophecy effect is a powerful psychological phenomenon in Nifty trading. When a significant number of traders anticipate and act upon a particular support or resistance level, their collective actions can cause that level to become a reality. This effect is amplified by:
- Technical analysis popularity
- Algorithmic trading systems
- Media coverage of key levels
As traders observe these levels holding or breaking, it further reinforces their belief in the importance of support and resistance, creating a feedback loop that strengthens these psychological price barriers.
Trading Strategies Using Support and Resistance
Bounce Trading
Bounce trading is a popular strategy that capitalizes on the tendency of prices to reverse direction at support and resistance levels. Traders look for opportunities to:
- Buy near support levels when prices bounce upwards
- Sell near resistance levels when prices bounce downwards
This strategy requires patience and precise entry timing. Confirmation signals, such as candlestick patterns or technical indicators, can help improve accuracy.
Breakout Trading
Breakout trading involves entering trades when the price moves beyond established support or resistance levels. Key aspects include:
- Entering long positions when price breaks above resistance
- Entering short positions when price breaks below support
- Using volume as a confirmation tool for genuine breakouts
| Breakout Type | Entry Point | Stop Loss Placement |
|---|---|---|
| Bullish | Above resistance | Below the breakout candle |
| Bearish | Below support | Above the breakout candle |
Range Trading
Range trading exploits the price movement between support and resistance levels. Traders can:
- Buy at support and sell at resistance in a sideways market
- Use oscillators like RSI or Stochastic to identify overbought and oversold conditions
Stop Loss Placement
Effective stop loss placement is crucial for risk management:
- Place stops below support for long trades
- Set stops above resistance for short trades
- Use a buffer to account for minor price fluctuations
Take Profit Targets
Setting appropriate take profit targets helps maximize gains:
- Use previous support/resistance levels as targets
- Implement trailing stops to capture extended moves
- Apply Fibonacci extension levels for potential reversal points
Now that we've covered various trading strategies using support and resistance, let's explore common mistakes traders should avoid when implementing these techniques.
Common Mistakes to Avoid
Overreliance on single levels
One of the most common pitfalls traders face is placing too much emphasis on a single support or resistance level. While these levels are important, they should not be viewed in isolation. Instead, consider multiple levels and zones to gain a more comprehensive understanding of market dynamics.
| Mistake | Consequence | Better Approach |
|---|---|---|
| Focusing on a single level | Missed opportunities or false breakouts | Identify multiple levels and zones |
| Rigid stop-loss at exact level | Premature exit from trades | Use a range or zone for stop-loss placement |
| Ignoring nearby levels | Incomplete market analysis | Consider clusters of support/resistance levels |
Ignoring time frames
Another crucial mistake is failing to consider different time frames when analyzing support and resistance levels. What appears as a strong level on a daily chart may be less significant on a weekly or monthly chart.
- Always analyze multiple time frames:
- Higher time frames for overall trend
- Lower time frames for entry and exit points
- Intermediate time frames for confirmation
Failing to adapt to changing market conditions
Markets are dynamic, and support/resistance levels can shift or lose relevance over time. Traders who rigidly adhere to outdated levels may find themselves out of sync with current market conditions.
To avoid this mistake:
- Regularly reassess and update your support/resistance levels
- Pay attention to recent price action and volume
- Be prepared to adjust your strategy as market conditions evolve
Now that we've covered common mistakes to avoid, let's explore some advanced techniques for using support and resistance in your trading strategy.
Advanced Techniques
Multiple time frame analysis
Multiple time frame analysis is a powerful technique for identifying robust support and resistance levels in Nifty trading. By examining charts across different timeframes, traders can gain a more comprehensive view of market dynamics.
| Timeframe | Purpose |
|---|---|
| Long-term | Identify major support/resistance |
| Medium-term | Spot intermediate levels |
| Short-term | Fine-tune entry and exit points |
This approach helps confirm the strength of support and resistance levels, as those visible across multiple timeframes are generally more significant.
Combining with other indicators
Integrating support and resistance analysis with other technical indicators can enhance trading decisions. Some effective combinations include:
- Moving averages
- Relative Strength Index (RSI)
- Fibonacci retracements
- Bollinger Bands
By using these indicators in conjunction with support and resistance levels, traders can validate potential breakouts or reversals, leading to more informed trading decisions.
Volume confirmation
Volume plays a crucial role in confirming the strength of support and resistance levels. High volume near these levels indicates increased interest and can signal potential breakouts or reversals. Traders should look for:
- Increased volume at support/resistance
- Volume spikes during breakouts
- Declining volume during consolidation
Price action patterns at support and resistance
Recognizing specific price action patterns at support and resistance levels can provide valuable insights. Key patterns to watch for include:
- Pin bars (bullish or bearish)
- Engulfing candles
- Doji formations
- Double tops/bottoms
These patterns can signal potential reversals or continuations when they occur at established support or resistance levels, offering traders additional confirmation for their trading decisions.
Below is a custom TradingView script using Pine Script to identify support and resistance levels for Nifty. This script identifies levels based on recent pivot highs and lows, marking them on the chart. It is dynamic and adjusts based on market movements.
Pine Script Code (TradingView)
//@version=5
indicator("Support & Resistance Levels for Nifty", overlay=true)

// Input parameters for customization
pivot_high_length = input.int(5, title="Pivot High Length", minval=1)
pivot_low_length = input.int(5, title="Pivot Low Length", minval=1)
line_color = input.color(color.new(color.blue, 0), title="Line Color")
line_style = input.string("Dashed", options=["Solid", "Dashed", "Dotted"], title="Line Style")

// Pivot Highs and Lows
pivot_high = ta.pivothigh(high, pivot_high_length, pivot_high_length)
pivot_low = ta.pivotlow(low, pivot_low_length, pivot_low_length)

// Collect Support and Resistance levels
var float[] support_levels = array.new_float(0)
var float[] resistance_levels = array.new_float(0)

// Add new levels
if not na(pivot_low)
array.push(support_levels, pivot_low)
if not na(pivot_high)
array.push(resistance_levels, pivot_high)

// Keep only the last 10 levels to avoid clutter
if array.size(support_levels) > 10
array.shift(support_levels)
if array.size(resistance_levels) > 10
array.shift(resistance_levels)

// Plot Support and Resistance levels
for i = 0 to array.size(support_levels) - 1
line.new(bar_index[array.get(support_levels, i)], array.get(support_levels, i),
bar_index, array.get(support_levels, i),
width=1, color=line_color, style=line_style == "Solid" ? line.style_solid : line.style_dashed)

for i = 0 to array.size(resistance_levels) - 1
line.new(bar_index[array.get(resistance_levels, i)], array.get(resistance_levels, i),
bar_index, array.get(resistance_levels, i),
width=1, color=line_color, style=line_style == "Solid" ? line.style_solid : line.style_dashed)

// Display last levels for reference
label.new(bar_index[1], high, "Last Resistance: " + str.tostring(array.get(resistance_levels, array.size(resistance_levels) - 1)), style=label.style_circle, color=color.red, textcolor=color.white)
label.new(bar_index[1], low, "Last Support: " + str.tostring(array.get(support_levels, array.size(support_levels) - 1)), style=label.style_circle, color=color.green, textcolor=color.white)
How to Use:
- Copy the above code.
- Open TradingView.
- Go to the Pine Editor and paste the script.
- Click Add to Chart.
- Customize the inputs in the settings.
Conclusion
Support and resistance levels are crucial tools for traders analyzing the Nifty index. By understanding these key price points, investors can make more informed decisions about potential entry and exit positions. From identifying various types of support and resistance to comprehending the psychology behind these levels, traders can develop effective strategies to capitalize on market movements.
As you incorporate support and resistance analysis into your trading approach, remember to avoid common pitfalls and consider advanced techniques to refine your strategy. By mastering these concepts and applying them judiciously, you can enhance your ability to navigate the Nifty market with greater confidence and precision. Keep practicing, stay disciplined, and always be prepared to adapt your approach as market conditions evolve.
Disclaimer:
The information provided in this article on "Support and Resistance for Nifty" is for educational and informational purposes only and should not be considered financial, investment, or trading advice. Trading in the stock market, including the Nifty 50, carries risks, and past performance is not indicative of future results. The concepts of support and resistance are based on general market principles and may not always be accurate. Readers should conduct their own research, consult a qualified financial advisor, and trade responsibly at their own risk. The author and publisher are not liable for any losses or damages arising from the use of this information.